- info@manasjaiswal.com
- 9935027113


NIFTY View For 23/10/2026
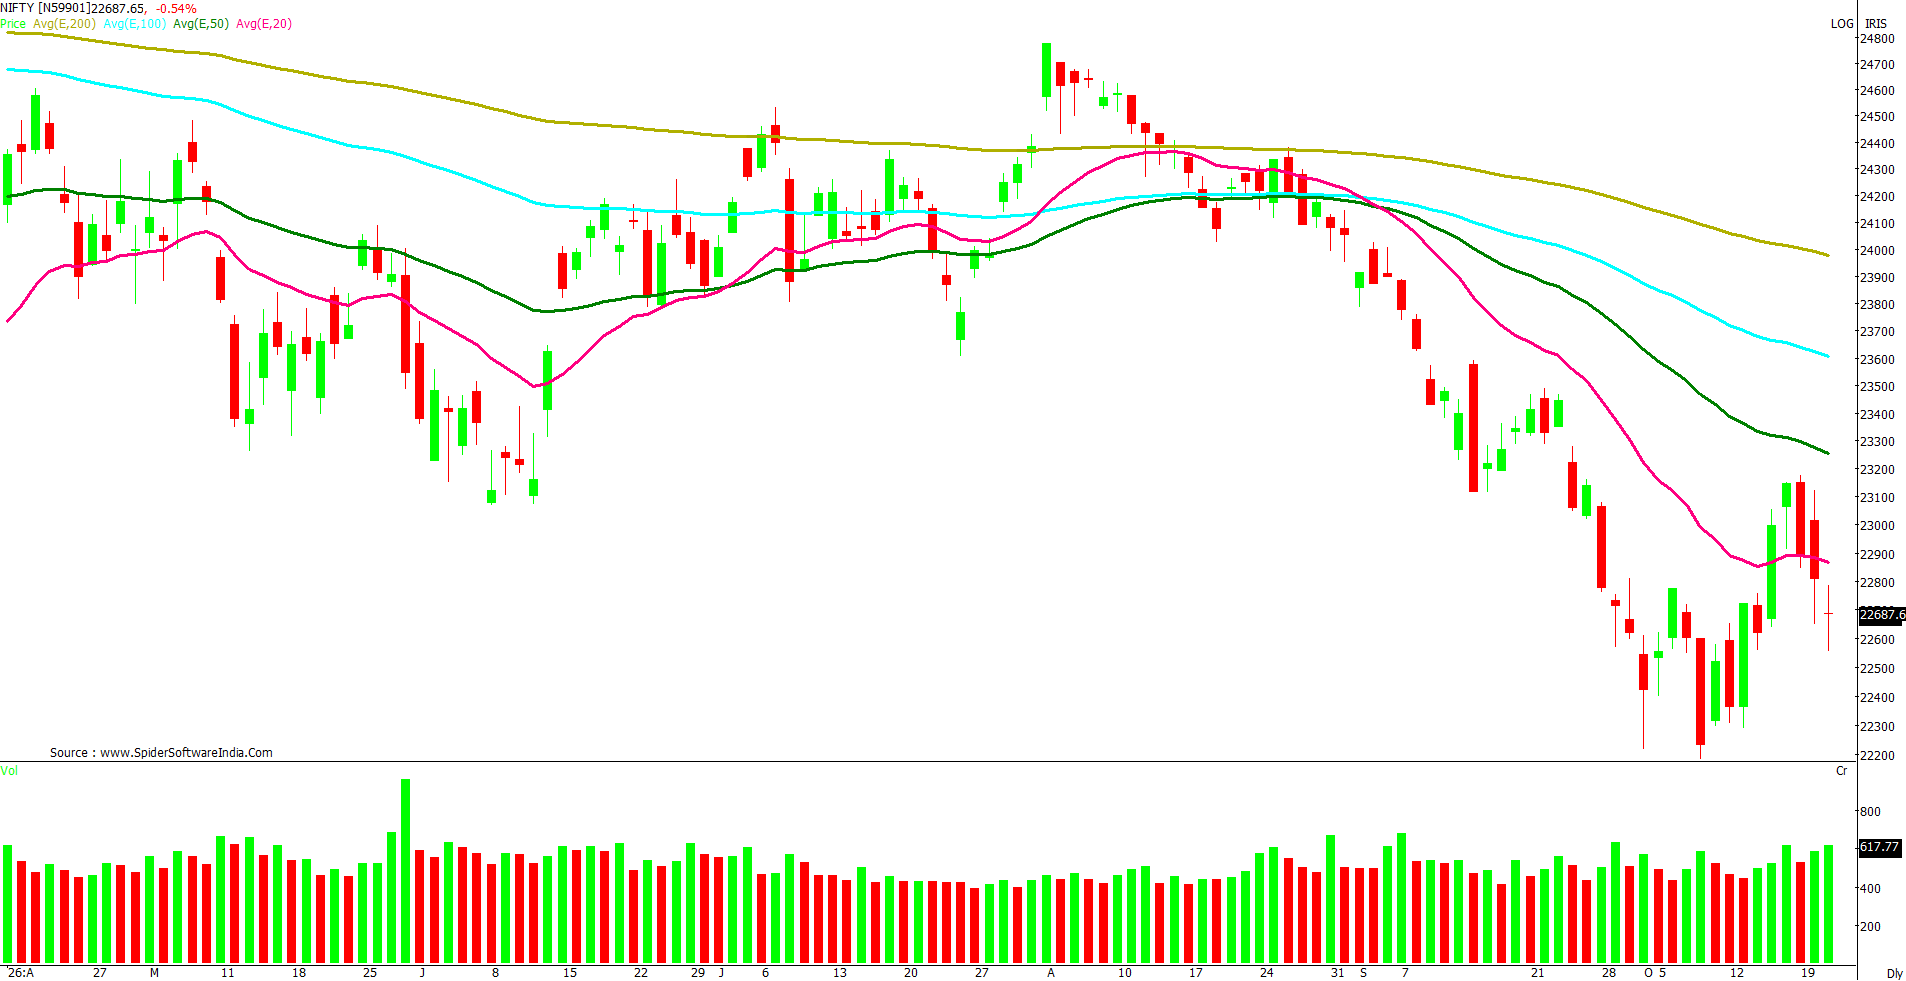
Yesterday, NIFTY opened on a negative note and fell below the 22,600 mark in early trade. However, the index found support near 22,550 and thereafter traded within a narrow range of 22,600–22,750 throughout the session. It eventually closed just below 22,700.
NIFTY is trading below the 10-DEMA, which is placed near 22,790; therefore, we should remain cautious. If the index breaks below 22,550, it could witness further weakness and test the 22,300 level.
On the upside, the 23,000–23,100 zone will act as an important resistance area. Therefore, fresh long positions should be considered only on a decisive breakout above 23,100.
Nifty Imp Levels For 23/10/2026
| Open | 22687 |
| High | 22785 |
| Low | 22554 |
| Close | 22687 |
| S 1 | 22566 |
| S 2 | 22445 |
| R 1 | 22796 |
| R 2 | 22905 |
Actionable Ideas On Nifty for 23/10/2026
| Action | SL | TGT |
|---|---|---|
| Buy above 22800 | 22700 | 23000 |
| Sell below 22550 | 22650 | 22350 |
Show Timings

CNBC Awaaz
23rd OCT @ 2.00pm - 3.30pm

CNBC Awaaz
23rd OCT @ 8.00am - 10.00am